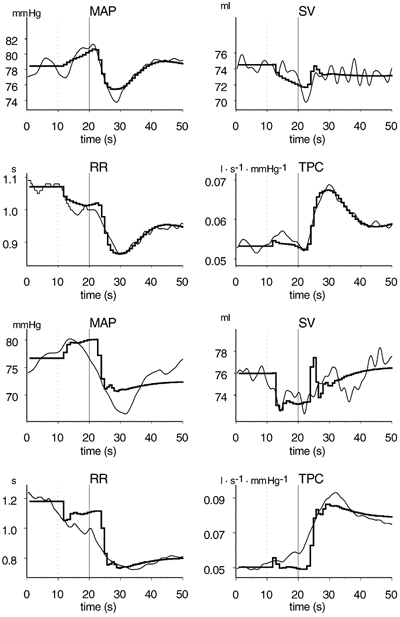
Figure 4. Recorded (narrow lines) and simulated (thick lines) time courses of cardiovascular responses in subject 1 (four upper panels, best simulation run) and subject 9 (four lower panels, poorest simulation run).

The dotted lines at 10 s indicate the start of countdown, and the continuous lines at 20 s indicate the onset of exercise. MAP, mean arterial pressure; RR, RR interval; SV, stroke volume; TPC, total peripheral conductance.
