
Figure 2. Effects of hypoxia on mean arterial blood pressure and heart rate.
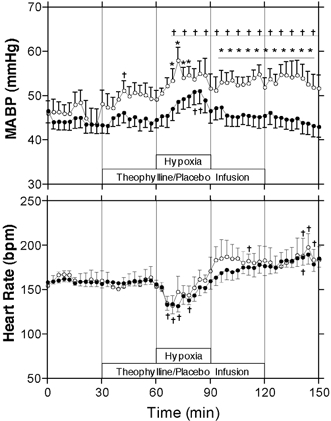
Arterial blood pressure and heart rate ± s.e.m. during baseline, hypoxia and recovery periods. * Significant difference between control (•, n = 12) and theophylline (○, n = 7) groups (P < 0.05, two-way ANOVA); † significant difference from mean of pre-infusion period (P < 0.05, one-way ANOVA).