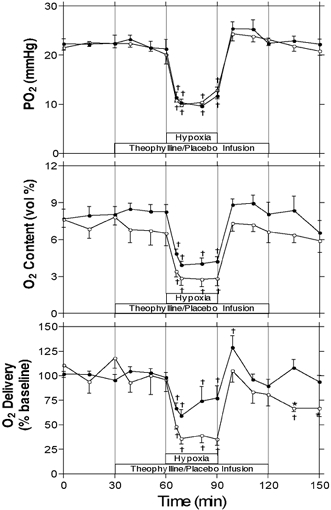
Figure 3. Effects of hypoxia on arterial PO2, oxygen content and cerebral oxygen delivery.

Arterial PO2, oxygen content and cerebral oxygen delivery ± s.e.m. during baseline, hypoxia and recovery periods. Cerebral oxygen delivery was calculated as the product of arterial oxygen content (percentage of baseline) and laser Doppler flowmetry (percentage of baseline) at the time the blood sample was collected. * Significant difference between control (•, n = 12) and theophylline (○, n = 7) groups (P < 0.05, two-way ANOVA); † significant difference from mean of pre-infusion period (P < 0.05, one-way ANOVA).
