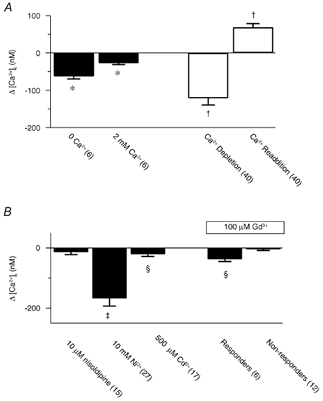
Figure 10. Pharmacological inhibition of store depletion-induced Ca2+ entry in renal ASMCs.

A, change in the cytosolic [Ca2+] compared to the resting cytosolic [Ca2+] for control (▪) and store-depleted (□) experiments. B, change in the cytosolic [Ca2+] from that measured during CCE. Error bars represent ± s.e.m. Numbers of independent experiments are shown in parentheses. * Mean significantly different from control (P < 0.05); repeated measures ANOVA with Dunnett's multiple comparison procedure. † Mean significantly different from control (P < 0.05); Friedman repeated measures ANOVA on ranks with Dunnett's multiple comparison procedure. ‡ and § Mean significantly different from control (P < 0.05) by Wilcoxon signed rank test or paired t test, respectively.
