
Figure 1. Metabolic rate depression during anoxic submergence at 24 °C (top) and 3 °C (bottom).
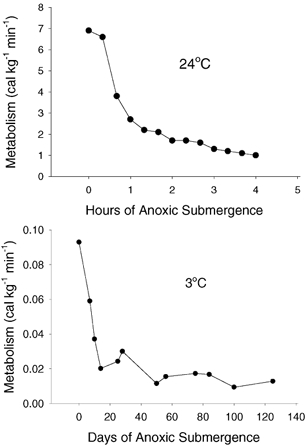
Note the similarity in pattern but the time scale difference and the 100-fold difference in the final metabolic values. Data adapted from Jackson (1968), Jackson & Heisler (1982) and Jackson et al. (2000).