
Figure 4. PS in a single frog capillary (radius 15 μm) for two different flow velocities (U).
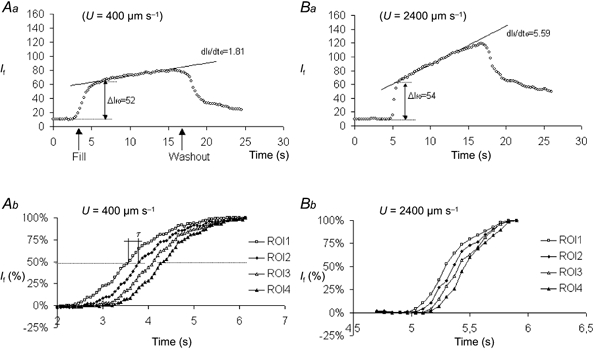
Aa and Ba show the fluorescent light intensity (If, nondimensional units 0–160) measured from a ROI covering a frog venular capillary and surrounding tissue before, during and after perfusion with sodium fluorescein. Changes in If with time are shown during perfusion at low (Aa) and high (Ba) values of U. Both records show that If increases rapidly from a low background to a similar level as the fluorescent perfusate fills the vessel. Then, a less rapid increase in If accompanies the diffusional flux of fluorescent molecules through the vessel wall. Note the greater rate of increase of If when U was high during this phase. When perfusate is switched back to the nonfluorescent solution (washout), a sharp decrease in If is seen and approximately 1 min later If is restored to the initial low background. PS calculated from data in Aa was 0.26 μm s−1 and from data in Ba it was 0.77 μm s−1. Ab and Bb show data used to determine U in these perfusions. If was measured over four ROIs (each one was 83 μm long and 160 μm wide) as the vessel filled with sodium fluorescein. The ROIs were set adjacent to each other along the vessel. The transit time for the perfusate to reach 50 % of If0 between consecutive ROIs was estimated. U was calculated from the distance between the centres of adjacent ROIs (83 μm) divided by the transit time. The average value for the perfusion shown in Ab was U = 400 μm s−1 and for that in Bb it was 2400 μm s−1.