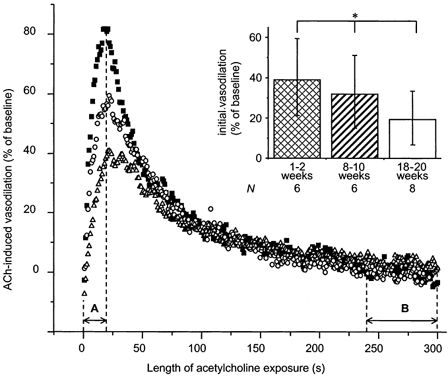
Figure 5. Acetylcholine-induced vasodilatation in the presence of l-NNA + indomethacin (1 mm + 10−5m) in age-matched controls: the initial response.

Each curve represents the averaged vasodilatory response to ACh of one age group, while each point represents a time average of 1 s. A, time to peak; B, the terminal 60 s interval of the 5 min exposure to ACh. Initial (inset) and terminal (Fig. 8B) responses are calculated as the area under the curve during A and B, respectively. Note that the ACh response during inhibition of NOS and COX was transient in spite of the continued presence of ACh. Importantly, the initial vasodilatory response declined with maturation in age-matched controls (inset, *P = 0.0410, analysis for linear trend). ▪, 1–2 week group; ○, 8–10 week group; and ▵, 18–20 week group.
