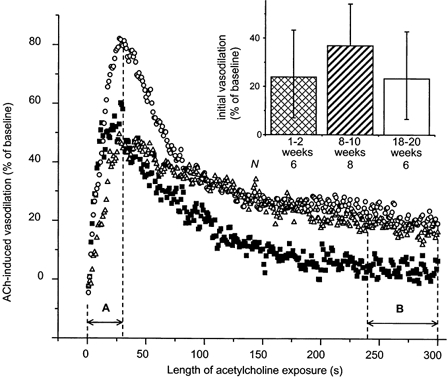
Figure 6. Acetylcholine-induced vasodilatation in the presence of l-NNA + indomethacin (1 mm + 10−5m) in STZ-induced diabetics: the initial response.

Each curve represents the averaged vasodilatory response to ACh of one age group, while each point represents a time average of 1 s. A, time to peak for the 8–10 week group (note that A varies, being less for the 1–2 week group and greater for the 18–20 week group); B, the terminal 60 s of the 5 min exposure to ACh. Initial (inset) and terminal (Fig. 8B) responses are calculated as the area under the curve during A and B, respectively. In contrast to age-matched controls, the initial response in STZ-induced diabetics did not decrease (P = 0.6851, analysis for linear trend), although the magnitudes of the initial responses in age-matched controls and STZ-induced diabetics did not differ (P = 0.5882). Note the sustained terminal ACh responses in the 8–10 and 18–20 week STZ-induced diabetic groups (compare to Fig. 5). ▪, 1–2 week group; ○, 8–10 week group; and ▵, 18–20 week group.
