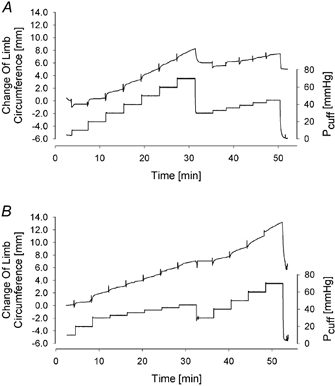
Figure 2. The different pressure protocols used in this VCP study.

The bottom trace, of these original records, depicts the pressure in the congestion cuffs (Pcuff), whereas the top trace represents the volume change. A, in the pressure protocol of Study I first a series of 10 mmHg pressure steps was applied. After intermediate reduction of Pcuff to 30 mmHg the congestion cuff was then re-inflated using cumulative pressure steps of 3 mmHg. B, in Study II the order of the pressure protocols was inverted and the 3 mmHg pressure steps were applied in the first phase of the VCP protocol.
