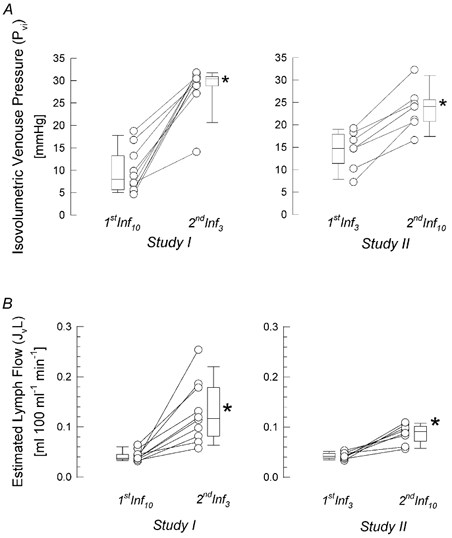
Figure 3. Changes of the microcirculatory parameters during different VCP protocols.

Individual as well as median [10th, 25th, 75th and 90th percentiles] values of isovolumetric venous pressure and predicted lymph flow are given. A, isovolumetric venous pressure (Pvi) obtained with the different pressure step protocols, before and after intermediate deflation (*P < 0.01; Wilcoxon signed rank test). B, predicted lymph flow (JvL) assessed subsequently with either 3 mmHg or 10 mmHg pressure steps (*P < 0.01; Wilcoxon signed rank test).
