
Figure 2. Frequency dependence of [Ca2+]i transients.
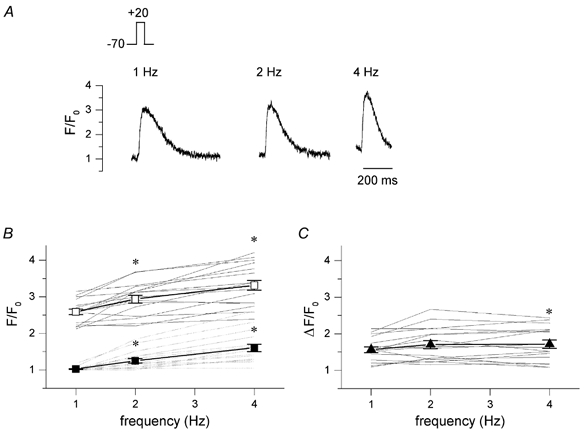
A, original current traces, I, and [Ca2+]i transients, F/F0, recorded in a voltage clamped cell during steady-state stimulation with 25 ms depolarizing steps from -70 to +20 mV at the indicated frequencies. B, individual data for frequency dependence of [Ca2+]i transients, F/F0, showing peak values (continuous lines) and baseline values (dashed lines) of 17 cells. Pooled data show an increase in peak [Ca2+]i (□) and baseline [Ca2+]i (▪) at higher stimulation frequencies (mean ± s.e.m., *P < 0.05 vs. 1 Hz). C, amplitude of the [Ca2+]i transients, ΔF/F0, with increasing stimulation rate (mean ± s.e.m., *P < 0.05 vs. 1 Hz).