
Figure 3. ERG amplitudes measured at fixed times after the stimulus for 20 subjects.
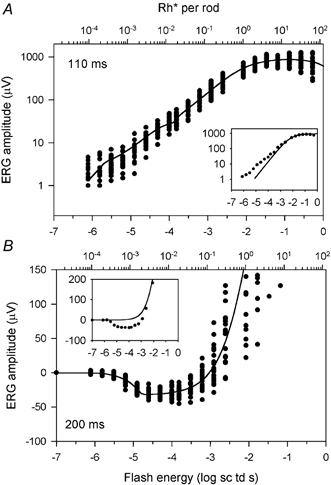
A, ERG amplitudes measured at 110 ms after the flash plotted vs. stimulus energy (log sc td s), on the bottom axis and Rh* per rod on the top axis. The symbols represent the data and the continuous line represents the average five-component model fit to the data. The inset shows data from one subject (MM149) with a fitted hyperbolic function (eqn (1)) fitted to the saturation of the curve. B, ERG amplitudes measured at 200 ms after the flash. The format is as in A. The inset shows data from one subject (MM180), with a fitted hyperbolic function (data for high stimulus energies not shown).