
Figure 4. Leg glycerol kinetics during rest, exercise and recovery.
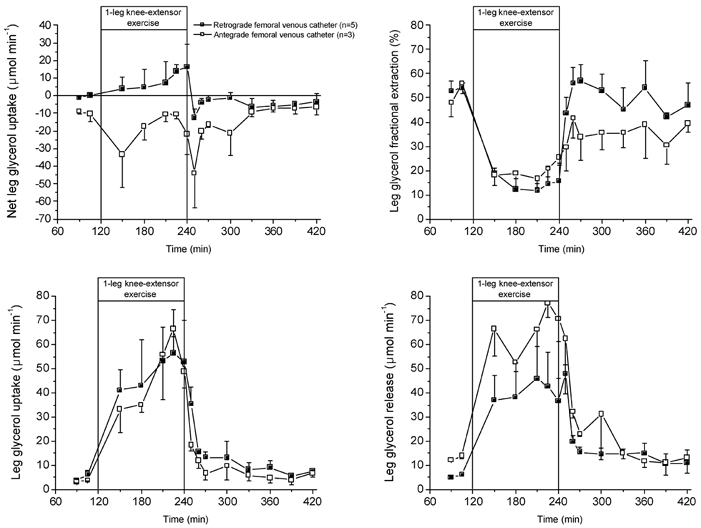
The closed squares represent FA kinetics when using for the femoral venous FA data from the femoral venous catheter in the retrograde position (n = 5), which excludes to a large extent contamination from subcutaneous adipose tissue (van Hall et al. 1998). The open squares represent the FA kinetics when using the femoral venous FA data from the femoral venous catheter in the commonly used antegrade direction (n = 3).