
Figure 6. Comparisons of the method of calculating shear stress.
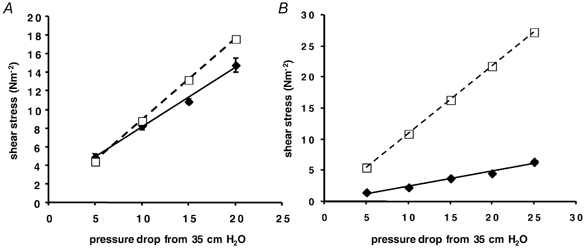
Shear stress calculated from the pressure difference (τ′, from eqn (8); □, dashed line) or from the red cell (fluid) velocity (τ, from eqn (7); ♦, continuous line) has been plotted against the pressure drop from one manometer to the other. In all four cases τ′ was higher than τ. A, τ is 93% of τ′. B, τ is 22% of τ′.