
Figure 13. Control Lp estimated during pressure balance is plotted against microvascular shear stress (τ) induced on the vessel walls during intervening perfusion.
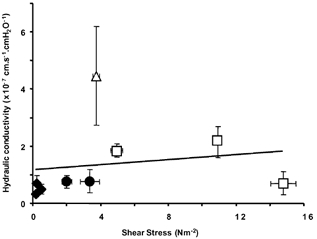
Nine levels of shear stress and Lp were measured in four vessels (each shape represents measurements in one vessel). For these four vessels, no relationship was observed between Lp and shear stress (slope = 0.1763, r2 = 0.03).