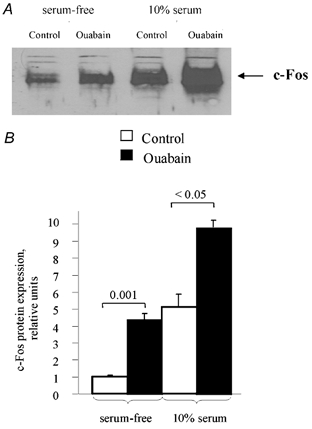
Figure 10. Additive effect of serum and ouabain on c-Fos expression.

A, representative blot showing c-Fos protein in control quiescent cells and cells treated with 1 mm ouabain and 10 % calf serum for 6 h. B, relative content of c-Fos protein after incubation with serum and/or ouabain. c-Fos content in untreated cells was taken as 1.0. Means ± s.e.m. obtained from three experiments are shown.
