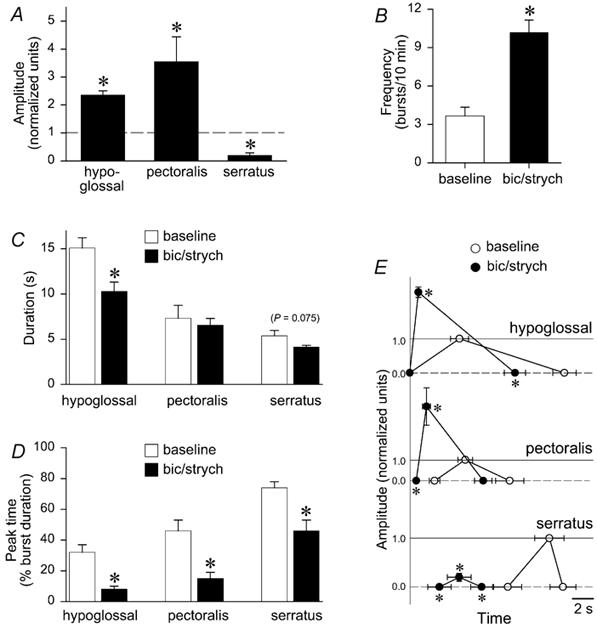
Figure 9. Characteristics of rhythm during brainstem GABAA and glycine receptor blockade.

Group data for brainstem-spinal cord preparations (n= 6) under baseline conditions, and following blockade of GABAA and glycine receptors in the brainstem. All data were averaged in 20 min bins. A, hypoglossal and pectoralis burst amplitude increased by 140 % and 260 %, respectively (P< 0.05), whereas serratus burst amplitude decreased by 80 % (P < 0.05). B, frequency increased significantly by nearly 7 bursts (10 min)−1. C, duration decreased in all three nerves, but a significant decrease was observed only in hypoglossal bursts. Open bars indicate baseline data; black bars indicate data during blockade of brainstem GABAA and glycine receptors. D, peak time significantly shifted from the middle to the beginning of the burst in hypoglossal and pectoralis nerves, whereas peak time significantly shifted from near the end of the burst to the middle of the burst for serratus nerves. E, burst onset, peak time, burst amplitude relative to baseline (horizontal dashed lines), and burst termination are graphed for baseline (○) and blockade of brainstem GABAA and glycine receptors (•) for hypoglossal, pectoralis, and serratus. All timing data are graphed with respect to the onset of hypoglossal activity. Baseline amplitude is set at 1.0 arbitrary units (horizontal continuous lines); amplitude at burst onset and burst termination is set at zero (horizontal dashed lines). * Significant differences with respect to baseline in terms of timing only; significant amplitude differences have already been indicated in Fig. 9A.
