
Figure 2. Changes in adenosine and inosine levels in the nucleus tractus solitarii in response to acute systemic hypoxia in anaesthetised rats.
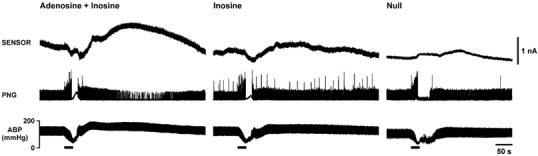
Hypoxia-induced changes in adenosine + inosine (measured by the mark-2 sensor, sensitive to adenosine and inosine; left panel) and inosine (measured by the mark-2 sensor, sensitive to inosine; middle panel) levels in the commissural nucleus tractus solitarii are presented as raw data obtained from the same rat. Right panel shows the small signal recorded during hypoxia by a null sensor placed in the NTS of another rat. Hypoxia was induced by ventilating the animal with 100 % nitrogen. Here and in subsequent figures, horizontal bars indicate duration of hypoxia; PNG, phrenic neurogram; ABP, arterial blood pressure. Signal recorded by the sensor sensitive to adenosine and inosine was markedly greater compared to signal recorded by the sensor sensitive to inosine and was observed during reoxygenation, after termination of the hypoxic stimulus.