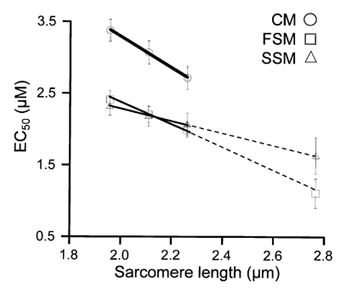
Figure 3. Relationship between Ca2+ sensitivity (EC50) and sarcomere length in skinned cardiac (CM), psoas (FSM), and soleus (SSM) muscle fibres.

The relationship in each muscle type was linear over the range of sarcomere lengths studied (1.95 μm, 2.10 μm and 2.25 μm) representing the working range of the heart. The slope of these relationships reflects the magnitude of length-dependent activation; the steeper the slope, the greater the shift in Ca2+ sensitivity with changes in length. The dashed line represents the linear extrapolation of these data to SL = 2.75 μm consistent with the Ca2+ sensitivity (EC50) obtained in a separate group skeletal muscle fibres at that length.
