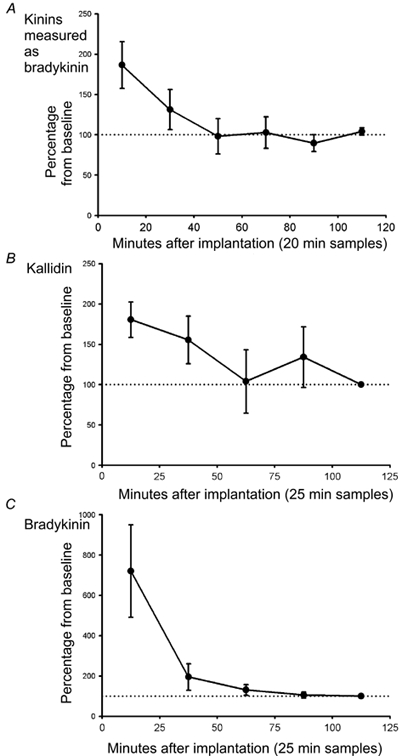
Figure 1. Kinin levels after insertion of a microdialysis probe in adductor muscle.

Changes (expressed as percentage of the mean concentration of the first baseline sample, mean ±s.e.m.) in the microdialysis concentration of kinin peptides (A; measured as bradykinin, n= 7), kallidin (B; n= 4) and bradykinin (C; n= 4) from the implantation of the microdialysis probe to the start of baseline sampling.
