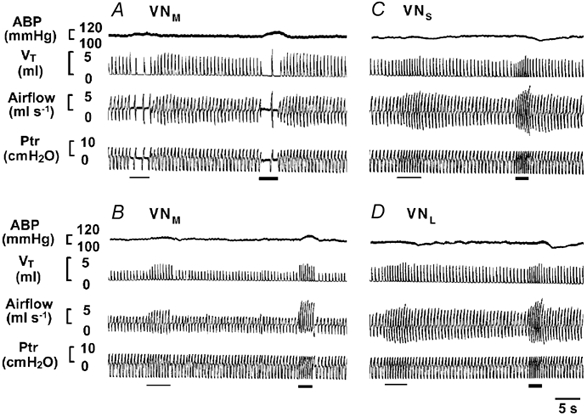
Figure 1. Experimental recordings of ventilatory and arterial blood pressure (ABP) responses to stimulation of the medial (VNM), lateral (VNL) and spinal (VNS) vestibular nuclei.

Experimental recordings of ventilatory and ABP responses to stimulation of the VNM (A and B), VNS (C) and VNL (D). In each panel, the traces from the top to bottom are ABP, tidal volume (VT), airflow and tracheal pressure (Ptr). Note that the thin and thick bars indicate stimulation at 100 and 150 Hz, respectively.
