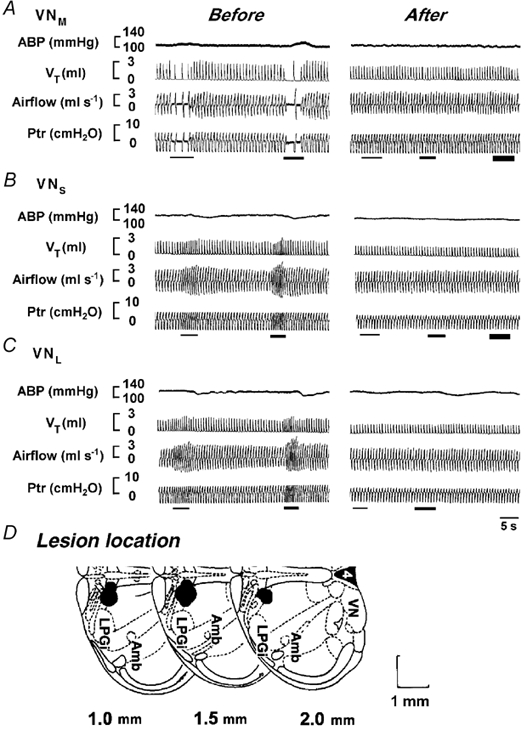
Figure 4. Comparison of the evoked cardiorespiratory responses immediately before and 2 h after NGC lesions.

A-C, the cardiorespiratory responses to stimulation of the VNM, VNS and VNL. In each panel, the traces from the top to bottom are ABP, VT, airflow and Ptr. Note that the first, second and third (if presented) stimulation denoted by bars indicate a stimulus intensity of 100, 150 and 200 Hz, respectively. Representative areas stained by Chicago Sky Blue (IA) injections are illustrated schematically (one side) in D, where the measurements given at the bottom are the distances rostral to the obex. LPGi, lateral paragigantocellular nucleus (see Paxinos & Watson, 1986).
