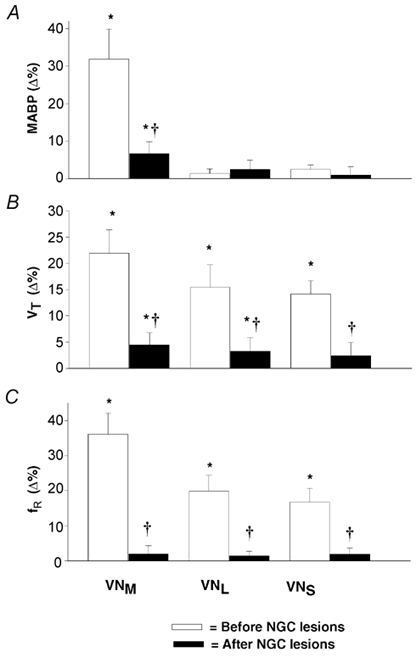
Figure 5. Group data showing the effects of NGC lesions on VN-stimulation-induced changes in MABP (A), VT (B) and respiratory frequency (fR; C).

The numbers of rats for stimulation of the VNM, VNL and VNS were 20, 8 and 7, respectively; the data are presented as means ±s.e.m.; *P < 0.05 compared to control, †P < 0.05 between the responses before and after bilateral IA injection into the NGC.
