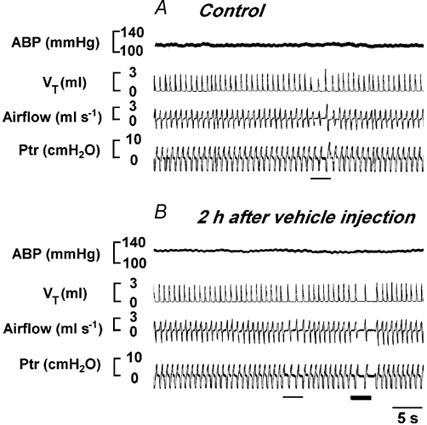
Figure 6. Cardiorespiratory responses to stimulation of the VNM before and 2 h after vehicle (100 nl) injection into the bilateral NGC in a rat.

In each panel, the traces from the top to bottom are ABP, VT, airflow and Ptr. The thin and thick bars indicate stimulation at 100 and 200 Hz, respectively.
