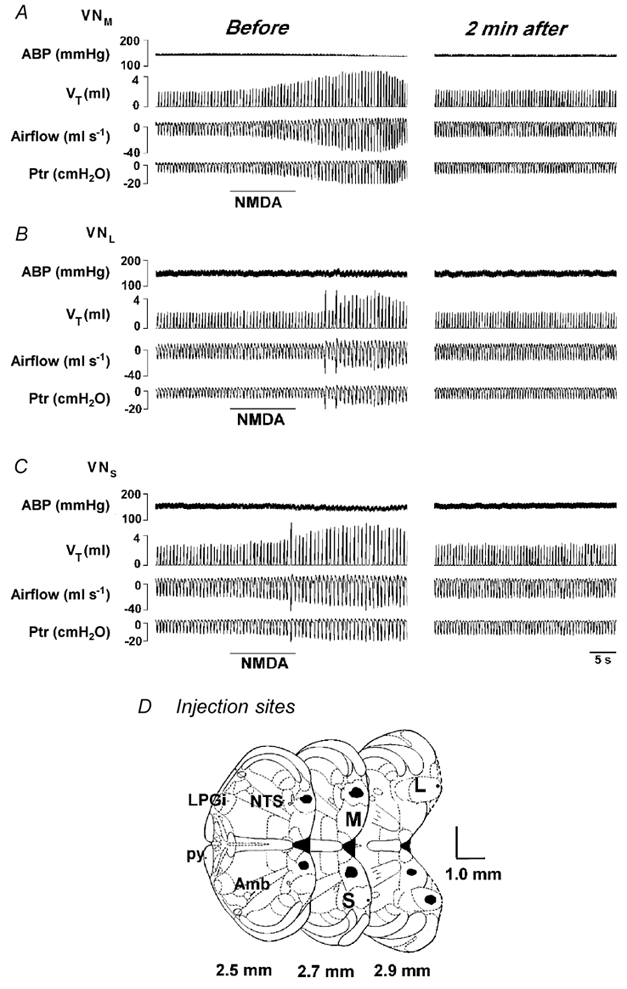
Figure 7. The cardiorespiratory responses to microinjection of N-methyl-d-aspartic acid (NMDA) into the VNM (A), VNL (B) and VNS (C).

The immediate responses and their recovery (2 min after NMDA injection) are illustrated in the left and right columns, respectively. In each panel, the traces from the top to bottom are ABP, VT, airflow and Ptr. The horizontal bars represent the duration of microinjection of 50 nl NMDA into the given subnucleus. Injection sites stained by Chicago Sky Blue are marked in D, in which the numbers listed are the distances rostral to the obex. py, pyramidal tract (see Paxinos & Watson, 1986).
