
Figure 4. Inhibition of antral A-type currents by flecainide.
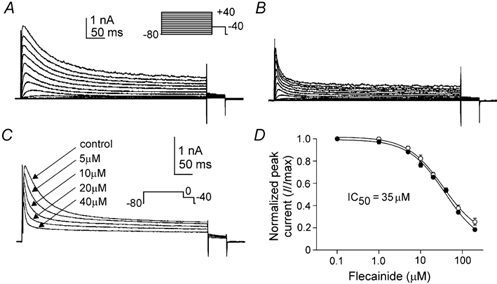
A and B, whole-cell A-type currents before (A) and after (B) external flecainide (20 μM). The membrane potential was stepped for 500 ms from −80 mV to potentials between −80 and +40 mV. C, whole-cell A-type currents (steps to 0 mV from −80 mV) before and after increasing concentrations of flecainide as indicated. D, normalized peak (•) and sustained (○) currents at 0 mV (I/Imax; not shown) were plotted as a function of flecainide concentration (ranging from 0.1 to 200 μM), and fitted with a variable slope logistic equation, from which IC50 values of 35.5 ± 0.7 μM (peak) and 36.3 ± 4.1 μM (sustained) were determined (n = 5).