
Figure 7. Quantification of Kv4 transcripts in antrum.
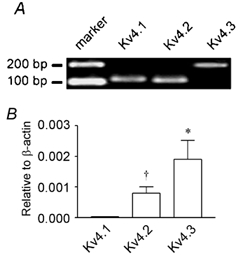
A, detection of Kv4 transcripts in isolated antral myocytes. From left to right: 100 bp marker; Kv4.1 (amplicon = 116 bp); Kv4.2 (amplicon = 111 bp); Kv4.3, long isoform (amplicon = 176 bp). Amplicon identity was confirmed by DNA sequencing; see Methods for primer sequences. B, Kv4.1, Kv4.2 and Kv4.3 gene expression relative to β-actin in the antrum as determined by real-time PCR. *Significantly greater expression of Kv4.3 transcripts relative to Kv4.1 and Kv4.2 (P < 0.05; n = 5); †significantly greater expression of Kv4.2 transcripts relative to Kv4.1 (P < 0.05; n = 5).