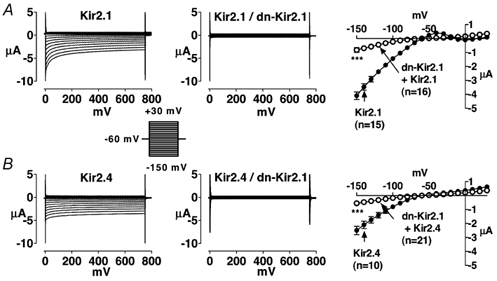
Figure 1. Currents recorded from Xenopus oocytes injected with Kir2.1 or 2.4 cRNA alone (left panels) or together with dn-Kir2.1 (middle panels) and corresponding mean current-voltage relationships (right panels).

A, results for Kir2.1 and B, results for Kir2.4. Mean ± s.e.m. current-voltage relations for 15 (Kir2.1), 16 (Kir2.1/dn-Kir2.1), 10 (Kir2.4), and 21 (Kir2.4/dn-Kir2.1) oocytes are illustrated on the right. Filled symbols represent currents recorded from oocytes injected with Kir2.x cRNA alone, whereas corresponding open symbols represent currents recorded from oocytes co-injected with equal amounts of Kir2.x cRNA and dn-Kir2.1 cRNA. *** P < 0.001 for significance of difference between current density in co-injected oocytes vs. Kir2.x.
