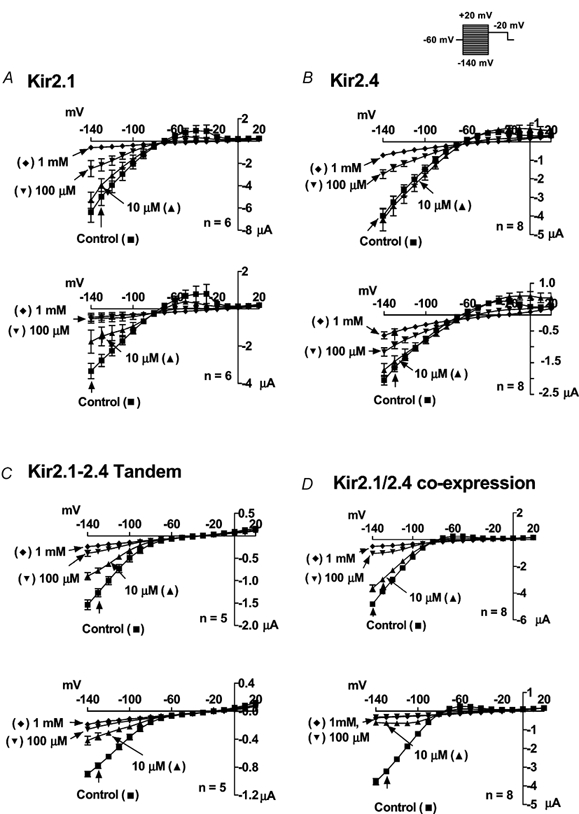
Figure 5. Mean ± s.e.m. current-voltage relations just after the onset of the voltage step (top panels) and under steady state conditions (bottom panels).

n = 6, 8, 5 and 8 oocytes for Kir2.1 (A), Kir2.4 (B), tandem (C) and co-injected constructs (D), respectively.
