
Figure 4. Time course of frequency depression and recovery.
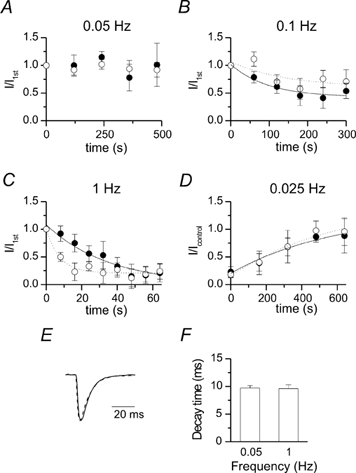
A-D, time course of normalized mean EPSC amplitude evoked at different frequencies (n = 5-6 neurons for A-C and 3 for D, see methods for normalization). Filled and open circles refer to the first and second EPSC, respectively. Data points were fitted with one exponential function. Continuous and dotted lines represent the fit to the first and the second EPSC, respectively. E, an example of normalized and superimposed mean EPSC evoked at 0.05 (continuous line) and 1 Hz (dashed line) in one representative neuron. F, mean decay time constant of EPSC evoked at 0.05 and 1 Hz (n = 4).