
Figure 2. Interactions between MNSI and LICI.
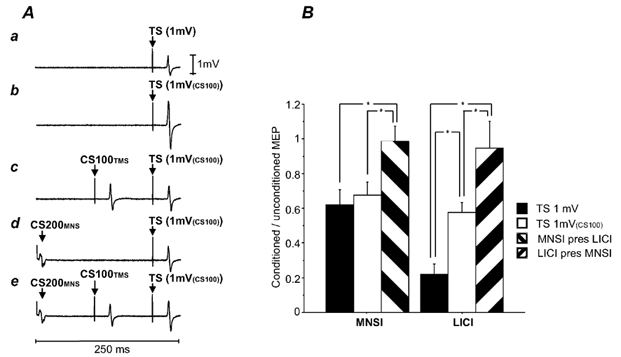
A, averaged MEPs of one subject in Experiment 2 (number of trials = 10). a, TS alone. The TS was adjusted to elicit MEPs of about 1 mV (TS 1 mV, condition 2A). b, TS 1 mV(CS100) alone. The TS was adjusted to produce test MEPs of 1 mV in the presence of a suprathreshold CS100TMS pulse (condition 2D). c, CS100TMS-TS 1 mV(CS100) pulse combination (condition 2E).The test MEP intensity matched the test MEP intensity in condition 2A. d, the effects of CS200MNS on the TS 1 mV(CS100) (condition 2F). e, effects of combining CS200MNS and CS100TMS (CS200MNS-CS100TMS-TS 1 mV(CS100) pulse combination, condition 2G). There is little further inhibition compared with c (LICI alone, condition 2E) and d (MNSI alone, condition 2F). B, interactions between LICI and MNSI. Error bars represent standard errors of the mean. The y-axis shows the ratio of the conditioned versus the unconditioned MEP. The left three columns show the results for MNSI: MNSI in the presence of LICI (MNSI pres LICI, hatched columns) was compared with the MNSI alone matched for test stimulus amplitude (TS 1 mV, filled columns) and test stimulus intensity (TS 1 mV(CS100), open columns). The right bars show LICI alone at 1 mV (filled columns) and 1 mV(CS100) (open columns) and LICI in the presence of MNSI (LICI pres MNSI, hatched columns). The asterisks indicate significant differences shown by Student's paired t test.