
Figure 2. Glucose-induced changes in [ATP]c.
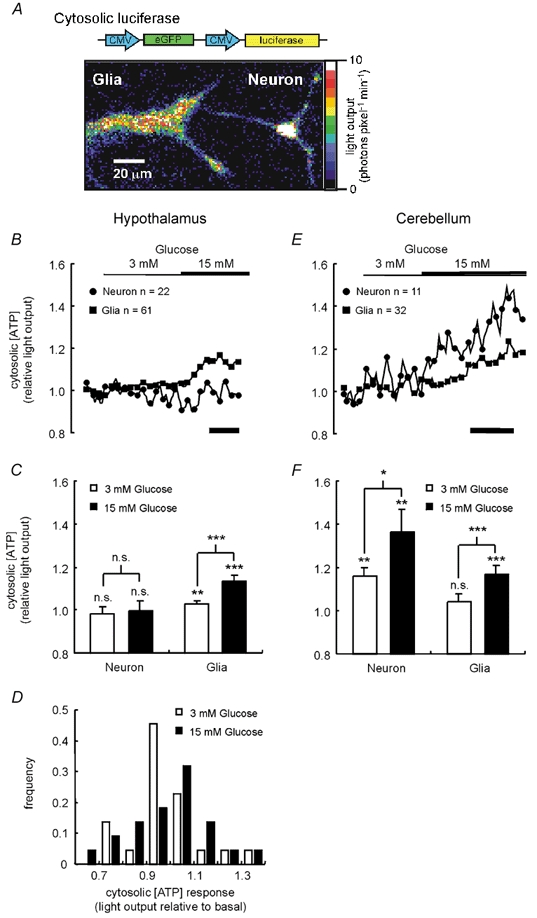
A, neuronal cultures were infected with virus AdCMVcLuc (Ainscow & Rutter, 2001), bearing cDNA encoding humanised firefly luciferase and eGFP each under a CMV promoter. Successfully infected individual glia and neurons, identified by eGFP expression, could be imaged and their light output, and thus [ATP]c, could be recorded in the presence of 0.5 μM luciferin. Shown is a pseudo-colour image of the light output from cultured hypothalamic cells. B and E, the dynamic response of [ATP]c to stepped increases of [glucose] from 0 to 3 to 15 mm was imaged in neurons and glia isolated from the hypothalamus (B) or the cerebellum (E). Mean values (± s.e.m.) of the responses at time points later than 100 s after each increase in glucose concentration are given in C and F. D, a histogram of the individual responses of the hypothalamic neurons to both glucose concentrations failed to reveal any differential response of a subpopulation of cells. Significant changes from basal light output or differences between the effects of different additions were assessed by Student's t test: n.s., not significant; * P < 0.05; ** P < 0.01; *** P < 0.001. For clarity, in B and E data points are shown only at 60 s intervals. In B and E, calibration bars represent 200 s.