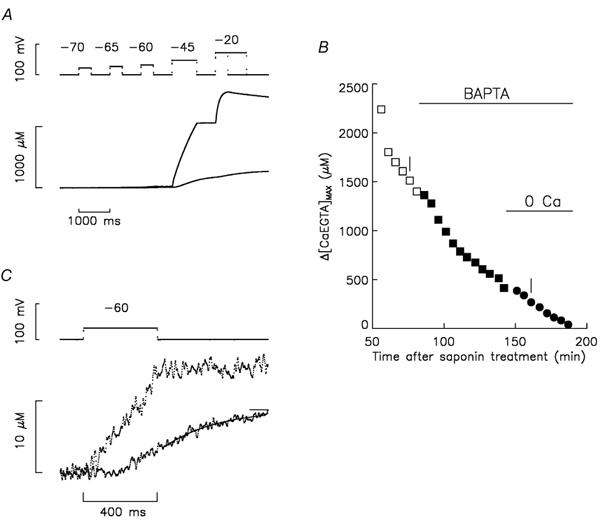
Figure 1. Effect of BAPTA on Δ[CaEGTA] and [CaEGTA]max vs. time of experiment.

A, the top traces show superimposed voltage signals before and 77 min after the addition of BAPTA. Given in order of application, pulses to -70, -65, -60, -45 and -20 mV had durations of 400, 400, 400, 800 and 400 (or 1200) ms, respectively. The duration of the period at -90 mV after the pulse to -60 mV was 600 ms. The bottom traces show the corresponding Δ[CaEGTA] signals. B, plots of Δ[CaEGTA]max vs. time after saponin treatment to permeabilise the fibre segments in the end pools. At 12 min, 0.8 mm phenol red was introduced into the end pools. The initial end-pool solution contained Ca and no BAPTA (□). At 84 min, the end-pool solution was exchanged for the one containing Ca and 8 mm BAPTA (▪). At 145 min, the end-pool solution was exchanged for the one containing no Ca and 8 mm BAPTA (•). The period of time between points was usually 5 min. C shows the same signals as in A for the pulse to -60 mV on an expanded scale. The interval of time between points was 1.25 ms. Fibre reference O05011. The following parameter values are for the stimulations before and after adding BAPTA, respectively, in A and C: fibre diameter, 112 and 106 μm; concentration of phenol red at the optical site, 1.34 and 2.56 mm; pHR, 6.959 and 7.064; Ih, -24 and -32 nA; Capp, 0.01184 and 0.01274 μF; cm, 0.164 and 0.173 μF cm−1; ri, 2.57 and 2.85 MΩ cm−1.
