
Figure 5. 5-HT3 receptors are present on a proportion of dorsal root ganglion (DRG) neurones.
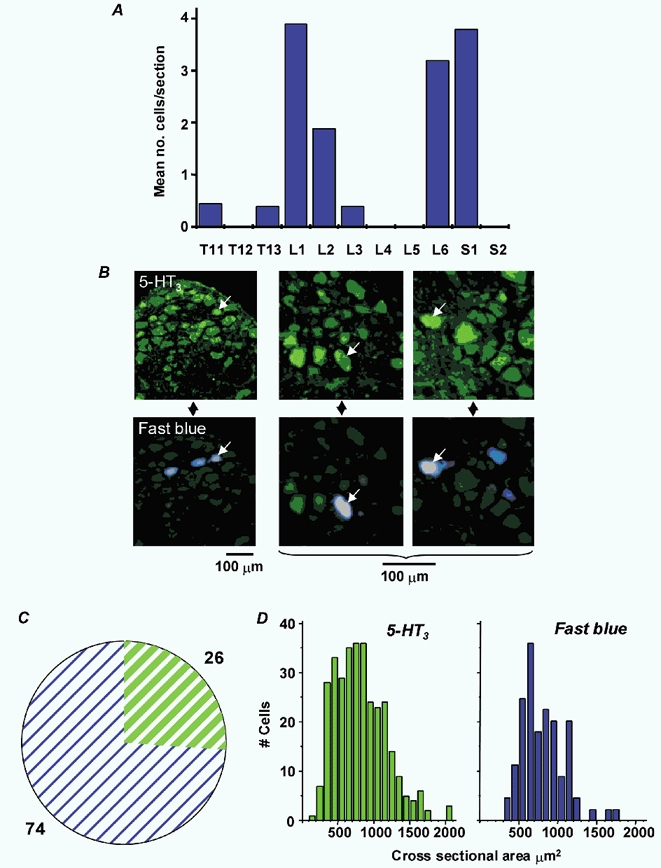
A, distribution of retrogradely labelled cells according to spinal segment. Data are expressed as mean number of labelled cells per section at each level. B, low- and medium-power fluorescence micrographs of L1 DRG showing 5-HT3 receptor immunohistochemistry in green (FITC) and retrograde label in blue (Fast Blue). Colocalization is indicated by the arrows in vertically paired images of the same section. C, pie chart showing percentages of retrogradely labelled cells immunoreactive for 5-HT3 receptors (green) vs. those lacking 5-HT3 receptor immunoreactivity (blue) in eight DRG from four animals. D, cell size distribution of 5-HT3 receptor-positive cells and retrogradely labelled cells.