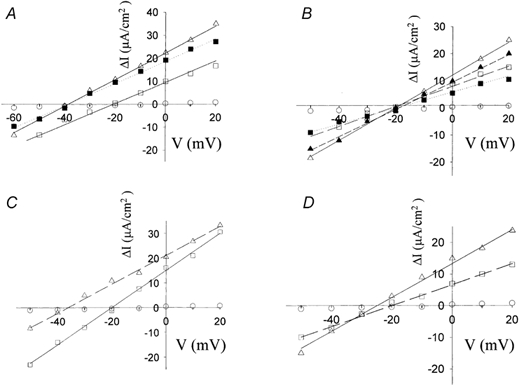
Figure 1. Current-voltage relationships of kNBC1 mutants in mPCT cells.

A, I-V relationships for wt-kNBC1 (□) and kNBC1-S982D mutant (▪) and wt-kNBC1-S982D in the presence (▵) of 8-Br-cAMP. B, kNBC1-NNNN mutant (open symbols) and EGFP-kNBC1-NNNN (filled symbols) in the absence (squares) or presence (triangles) of 8-Br-cAMP (100 μm). C, kNBC1-DNDN mutant in the absence (squares) or presence (triangles) of 8-Br-cAMP. D, kNBC1-NNDD mutant in the absence (squares) or presence (triangles) of 8-Br-cAMP. ○, I-V relationships of mock-transfected cells in A-D. All I-V relationships were measured at a 5-fold Na+ concentration gradient (basolateral/ apical = 50 mm/10 mm).
