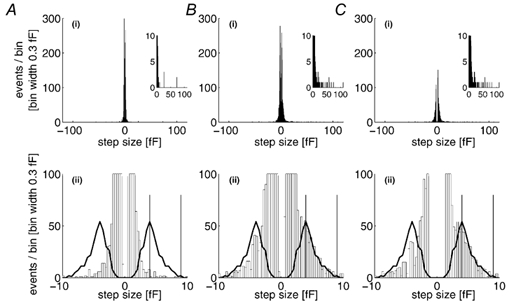
Figure 4. Amplitude histograms for detected Cm steps in unstimulated and high [Ca2+]i stimulated cells.

A(i) and B(i), the amplitude histograms for all exocytotic (positive) and endocytotic (negative) events detected during 1900 s of recording from four unstimulated cells (mean p-p noise 1.56 ± 0.39 fF; A), and 1920 s of recording during periods of stimulation by high [Ca2+]i in eight cells (mean p-p noise 1.56 ± 0.40 fF; B). The inset in each case shows the exocytotic events amplitude histogram on an expanded Y scale. A(ii) and B(ii), the same data on expanded X and Y scales, respectively, with the calculated distribution of WPb Cm superimposed on both the exocytotic and endocytotic distributions. The difference histogram (stimulated - unstimulated), displayed in the same way, is shown in C(i) and C(ii). The vertical lines on the lower panels indicate the region of the detected Cm steps used to calculate the frequency and kinetics of WPb exocytosis.
