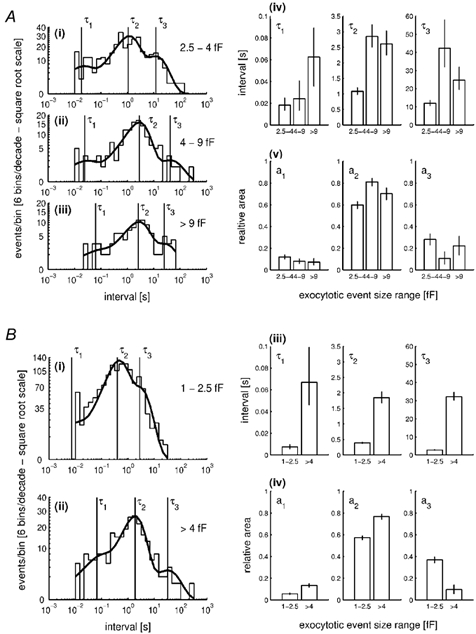
Figure 6. Distribution of intervals between exocytotic events during stimulation by high [Ca2+]i.

A, a comparison of interval distributions, plotted as the distribution of the logarithm of the time interval (Sigworth & Sine, 1987), for three subpopulations of exocytotic events: 2.5-4 fF (i), 4-9 fF (ii) and > 9 fF (iii). When generated in this way, an exponential probability density function (p.d.f.) is transformed so that it shows a peak at the value of the time constant. The distributions are limited on the lower end by the filtering bandwidth of 100 Hz (10 ms). Sums of three exponential distributions, with parameters of time constants (τ1-τ3) and relative areas (a1-a3), were fitted to the data so as to maximise the likelihood of the calculated distribution describing the actual distribution (Colquhoun & Sigworth, 1995). The continuous line shows a calculated sum of three exponential p.d.f. superimposed onto the distribution. Vertical lines indicate the positions of the three time constants. A(iv) and (v), a comparison of the parameters of the fitted distributions; time constants (τ1-τ3) and relative areas (a1-a3), respectively, among the three subpopulations. Vertical error bars correspond to ± -0.5 log likelihood limits. B(i) and (ii), the distribution of intervals for events of 1-2.5 and > 4 fF, respectively, produced in the same way as A(i)-(iii). B(iii) and (iv), a comparison of the parameters of the fitted distributions.
