
Figure 9. Effect of tropisetron on group responses of cardiac afferents during myocardial ischaemia.
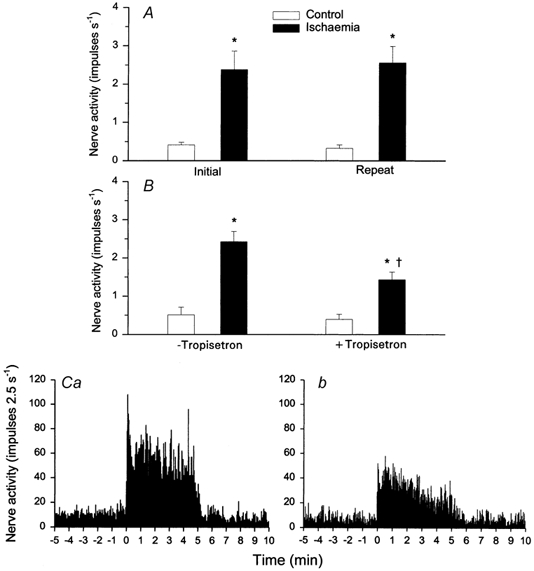
A, bar graph summarizing changes in activity of seven ischaemically sensitive cardiac afferents before (□) and during (▪) 5 min of repeated myocardial ischaemia. B, bar graph displaying discharge frequency of nine cardiac afferents before and during 5 min of ischaemia before (- tropisetron) and after (+ tropisetron) administration of tropisetron (300 μg kg−1, i.v.). C, neurohistograms provide summed 2.5 s discharge activity of all nine cardiac afferents during ischaemia before (Ca) and after (Cb) treatment with tropisetron. Columns and error bars represent means ± s.e.m. * P < 0.05vs. pre-ischaemia; † P < 0.05, post-tropisetron vs. pre-tropisetron.