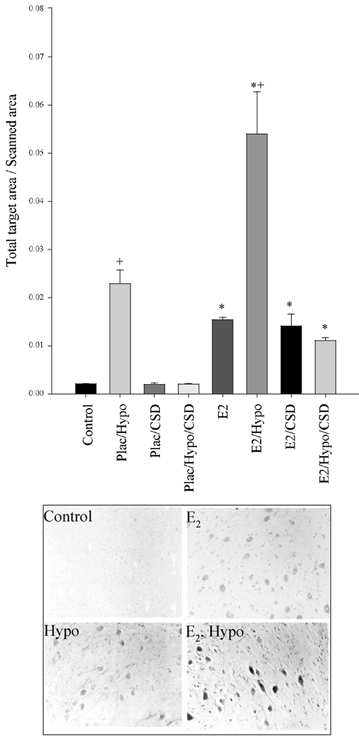
Figure 7. Fos immunohistochemistry staining in the fetal ovine nucleus of the tractus solitarius.

Plac = placebo implant, E2 = oestradiol implant, Hypo = hypotensive, CSD = carotid sinus denervated. There is a significant difference between Plac vs. E2 (* P < 0.001) and Control vs. Hypo (+P < 0.001). Representative photomicrographs are shown below the Fos densitometry.
