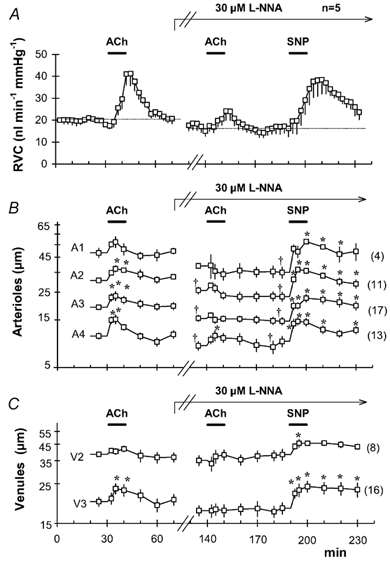
Figure 1. Changes in microvessel diameter and relative vascular conductance (RVC) induced by acetylcholine (ACh), NG-nitro-l-arginine (l-NNA) and sodium nitroprusside (SNP).

Time course of RVC (A), arteriolar (B) and venular (C) diameters measured simultaneously in 5 animals (mean ± s.e.m.). Microvessels from all 5 animals were grouped according to their branching order (arterioles A1-A4, venules V2-V3). The number of vessels in each category is shown in parentheses. After a 30 min baseline period, 100 μm ACh was applied topically for 10 min. Following 30 min of drug washout; superfusion with 30 μml-NNA was started and maintained for the remainder of the experiment (arrow). A second ACh application was administered after 60 min of nitric oxide synthase (NOS) inhibition with l-NNA. Finally, 10 μm SNP was applied topically after 120 min of NOS inhibition. Horizontal bars indicate the periods of superfusion with ACh or SNP. * Significant differences in vessel diameter as compared to the diameter immediately prior to each ACh or SNP application. † Significant difference between diameters at the moment just before the second ACh and SNP challenges, as compared to the initial control value (P < 0.05, paired t test, with Dunnett's tables for multiple comparisons against a single control).
