
Figure 5. Single-channel recordings of wild-type and truncated TASK-3.
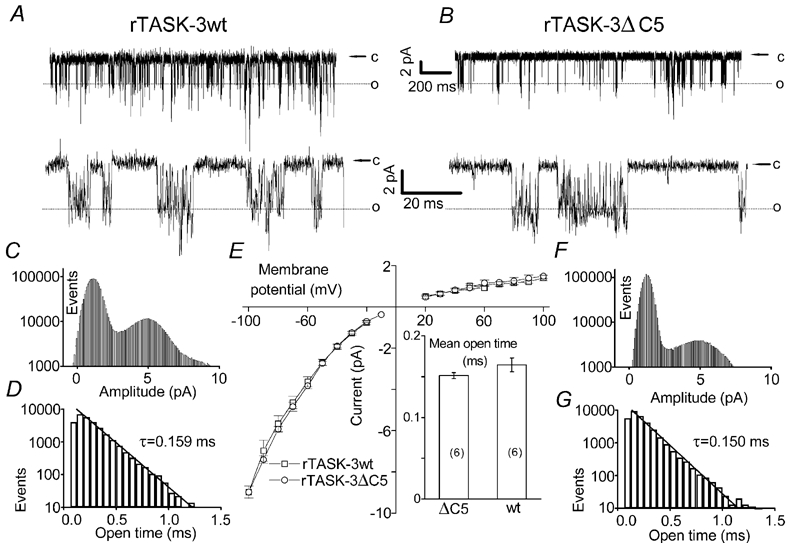
A and B, typical cell-attached recordings of wild-type rTASK-3 (A) and rTASK-3ΔC5 (B) channels expressed in HEK293 cells (transmembrane potential, −60 mV). The lower traces show parts of the record at higher time resolution. C and F, typical all-point histograms showing the number of data points per 0.08 pA bin. D and G, typical open time distributions (sampling rate, 15 kHz). E, single-channel current-voltage relation of wt rTASK-3 and rTASK-3ΔC5 (n =7 each). The conductance was estimated by applying a linear fit to the data points obtained between - 60 and - 100 mV for individual channels. The inset shows the mean open times wt rTASK-3 and rTASK-3ΔC5 (n =6 each). The recordings shown in A, C and D were from the same wt TASK-3 channel; the recordings shown in B, F and G were from the same rTASK-3ΔC5 channel.