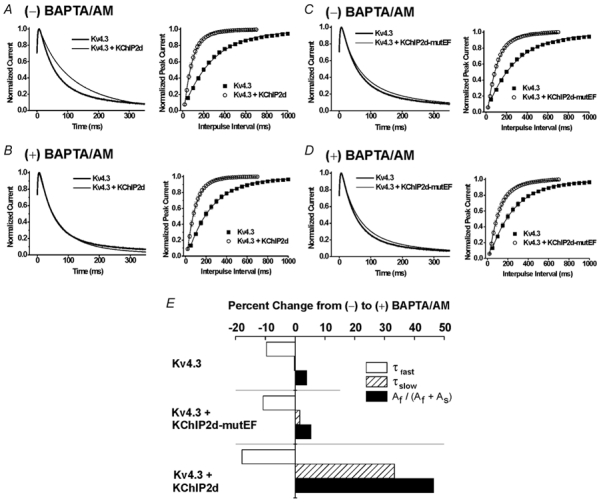
Figure 2. Ca2+ regulation of KChIP2d.

(-) BAPTA/AM indicates results obtained under initial control conditions; (+) BAPTA/AM indicates results recorded in the presence of 100 μm BAPTA/AM. Left panels: representative current recordings of Kv4.3 expressed alone (thick lines) or coexpressed with either KChIP2d or KChIP2d-mutEF (thin lines). Currents were recorded (2000 ms pulses to +50 mV from a holding potential (Vh) of −100 mV, normalized to peak and final steady-state values for comparative purposes) from the same oocytes before and after BAPTA/AM application. First 350 ms illustrated. Right panels: mean recovery kinetics (± s.e.m.; error bars not apparent when smaller than symbol) measured using a double-pulse P1-P2 protocol (P1 and P2 were 1000 ms pulses to +50 mV separated by variable interpulse intervals at Vh = −100 mV). A and B, Kv4.3 alone and Kv4.3+KChIP2d under control conditions (A) and after BAPTA/AM application (B). C and D, Kv4.3 alone and Kv4.3+KChIP2d-mutEF under control conditions (C) and after BAPTA/AM application (D). E, percentage change in time constants of inactivation from (-) to (+) BAPTA/AM. Kv4.3 expressed alone and expressed with either KChIP2d or KChIP2d-mutEF. Bars illustrate mean percentage change of τfast, τslow, and fractional contribution of the fast component of inactivation (Af/(Af + As)). Percentage changes calculated from mean values summarized in Table 1.
