
Figure 3. Transverse gradient of Ca2+ alternans.
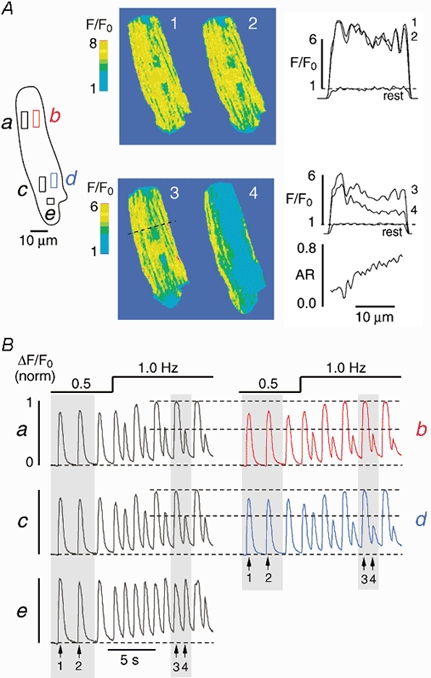
[Ca2+]i (F/F0) images (A) and normalized subcellular [Ca2+]i transients (B) from various regions of interest (a-e) recorded from an atrial myocyte under control conditions and during pacing-induced Ca2+ alternans. The increase in stimulation frequency from 0.5 to 1.0 Hz induces large Ca2+ alternans at sites a-d, but only small alternans at site e. The [Ca2+]i images (1-4) in A were taken during the shaded [Ca2+]i transients in B at the times indicated by the arrows. Profile plots (F/F0) along the dashed line recorded under control conditions (1, 2) and during Ca2+ alternans (3, 4) are illustrated on the right of panel A. 'Rest' denotes a profile plot obtained from the same line under resting conditions. The alternans ratio (AR), i.e. 1 minus the amplitude of profile 4 divided by profile 3, is shown on the lower right (A). It reveals a transverse gradient of Ca2+ alternans.