
Figure 4. Longitudinal gradient of Ca2+ alternans.
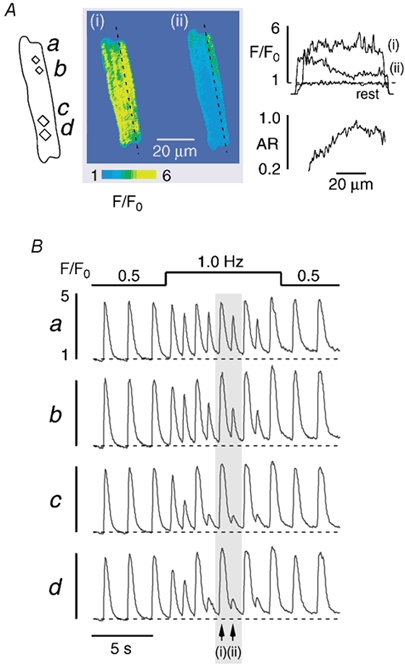
[Ca2+]i (F/F0) images (A) and subcellular [Ca2+]i transients from various regions (a-d) of an atrial cell (B). The increase in stimulation frequency from 0.5 to 1.0 Hz results in Ca2+ alternans that gradually increases from region a to d. The two images of the myocyte shown in A were taken during the shaded [Ca2+]i transients in B at the times indicated by the arrows. Profile plots (F/F0) along the dashed line are illustrated on the upper right (A) together with a profile plot obtained under resting conditions ('rest'). The AR (A, lower right) reveals a longitudinal gradient of Ca2+ alternans in the upper part of the cell.