
Figure 6. Focal inhibition of glycolysis induces subcellularly restricted Ca2+ alternans.
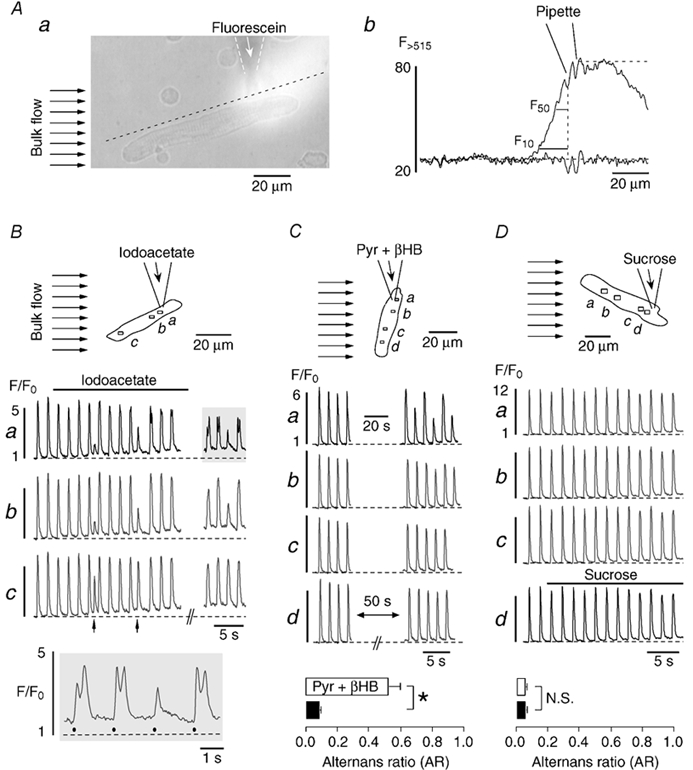
A, method for the focal application of inhibitors of glycolysis. A fluorescein-containing (20 μm) Tyrode solution was pressure-ejected from a glass micropipette (a). The bulk solution flow in the tissue bath (marked by the arrows to the left) restricted exposure of atrial myocytes to the region downstream of the tip of the pipette. Panel b shows fluorescein fluorescence profiles recorded along the dashed line in Aa before and during solution ejection from the pipette. Upstream of the pipette fluorescein fluorescence declined sharply to 50 % (F50) and 10 % (F10) of its maximum within 6.5 and 15.7 μm from the tip, respectively. B and C, focal application of inhibitors of glycolysis. D, focal application of sucrose. Atrial myocytes were continuously superfused with glucose-containing Tyrode solution (bulk flow, arrows in top panels). Iodoacetate (B), pyruvate plus β-hydroxybutyrate (Pyr + βHB) (C), or sucrose (D) were focally applied to part of the cells through the pipette. Middle panels (B-D): subcellular [Ca2+]i transients from various regions within the myocytes (a-d). The arrows in Bc mark spontaneous premature beats. Bottom panels: B, selected [Ca2+]i transients from Ba (shaded area) on an extended time scale. Filled circles indicate electrical stimulations. C and D, average alternans ratio of subcellular regions close to (□) and distant from (▪) the pipette tip during exposure to pyruvate plus β-hydroxybutyrate (n = 6 cells) and sucrose (n = 3 cells). *P < 0.01. N.S., difference statistically not significant. Stimulation frequency in all experiments was 0.6 Hz.