
Figure 1. mRNA distribution in polysomes following an acute bout of high resistance contractions.
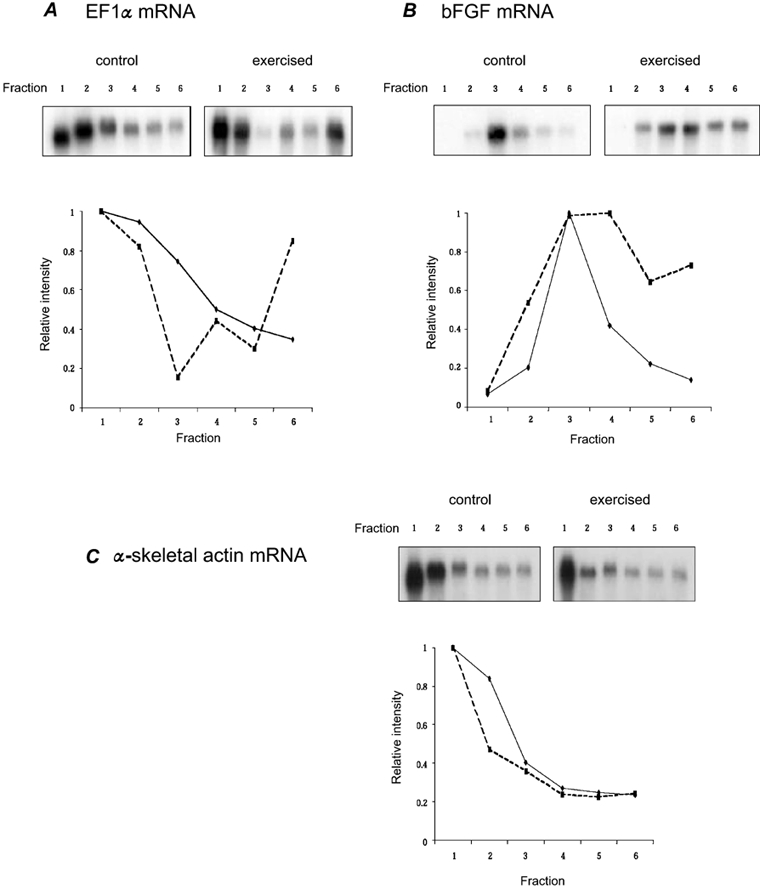
Each fraction represents the untranslated RNAs (fractions 1-3) and the heavier, translated mRNAs (fractions 4-6). Representative Northern blots are provided in the top panels with control muscle on the left and exercised muscle on the right. Results from the Northern blots were quantified using densitometry and the relative proportion of mRNA in each fraction has been quantified and presented graphically (lower panel). A, distribution of EF1α (elongation factor 1 α); B, distribution of basic fibroblast growth factor (bFGF); C, distribution of α-skeletal actin mRNA. For each graph, continuous line represents control and dashed line represents exercised.