
Figure 2. The relationship between cold, menthol and capsaicin sensitivity.
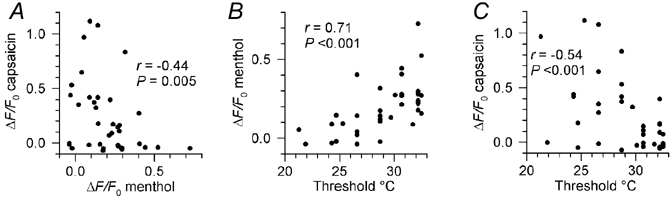
A, correlation between the amplitudes of the increases in [Ca2+]i (expressed as ΔF/F0) induced by 100 μm (-)-menthol and 0.5 μm capsaicin in cold-sensitive neurones. B and C, correlations between the rise in [Ca2+]i induced by menthol (B) and capsaicin (C) and the threshold temperature at which [Ca2+]i began to rise during cooling. Spearman rank correlation coefficients (r) are shown on each plot, along with the statistical significance (P) of the correlations.