
Figure 1. The time course of the development of voltage-dependent inactivation.
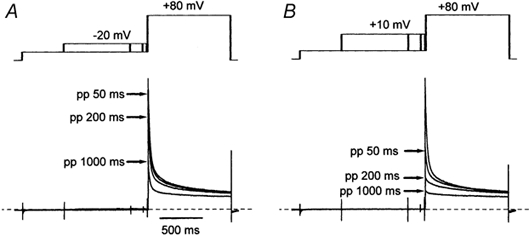
These normalised cell current traces were recorded from one representative isolated ventricular myocyte during pre-pulse voltage steps to −20 mV (A) and +10 mV (B) using the voltage-clamp protocol indicated schematically above the traces. For clarity only four traces representing currents recorded with no pre-pulse and pre-pulses of 50, 200 and 1000 ms duration (arrows) are shown here. The time scale is indicated by the horizontal bar in A. The dashed lines indicate the zero current level. Cell currents were recorded in the absence of extracellular Ca2+.