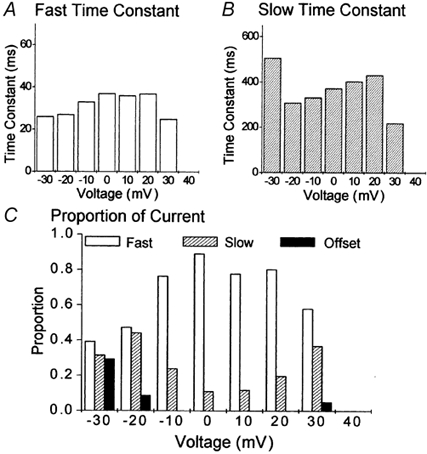
Figure 5. Total inactivation of ICa,L and membrane potential.

Analysis of the development of voltage-dependent inactivation was extracted from the details of the exponential functions fitted to the data in Fig. 4. A, the fast time constant of inactivation. B, the slow time constant of inactivation. C, the proportion of the total current occupied by fast inactivation, slow inactivation and an offset.
