
Figure 2. Spontaneous synaptic input to Purkinje neurons.
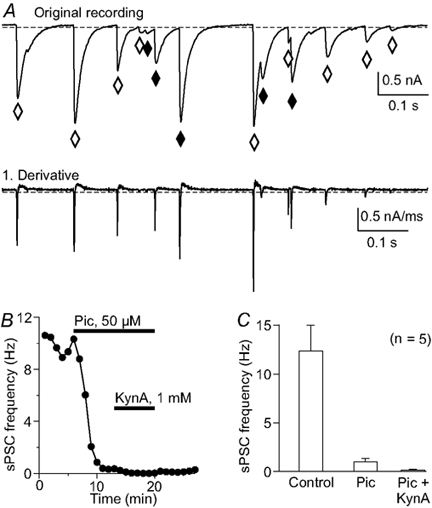
A, the original recording shows several spontaneous postsynaptic currents (sPSC) that would be missed by counting with a standard threshold method (♦) due to their initialization during the recovery phase of the previous PSC. Counting events using the first derivative of the original trace (lower panel in A) overcomes this problem. ⋄, events that are detected by both methods. B, the frequency of sPSCs after blocking inhibitory and excitatory receptors. Most events are identified as GABAergic using a block with picrotoxin (Pic; 50 μm); the remaining sPSCs were blocked by the iGluR antagonist kynurenic acid (KynA; 1 mm). Each point indicates the mean sPSC frequency of a 50 s continuous recording, counted with the method described in A. C, histogram summarizing the sPSC frequency reduction from 5 experiments like that in B with the same antagonists.